Read the Weight Trend chart
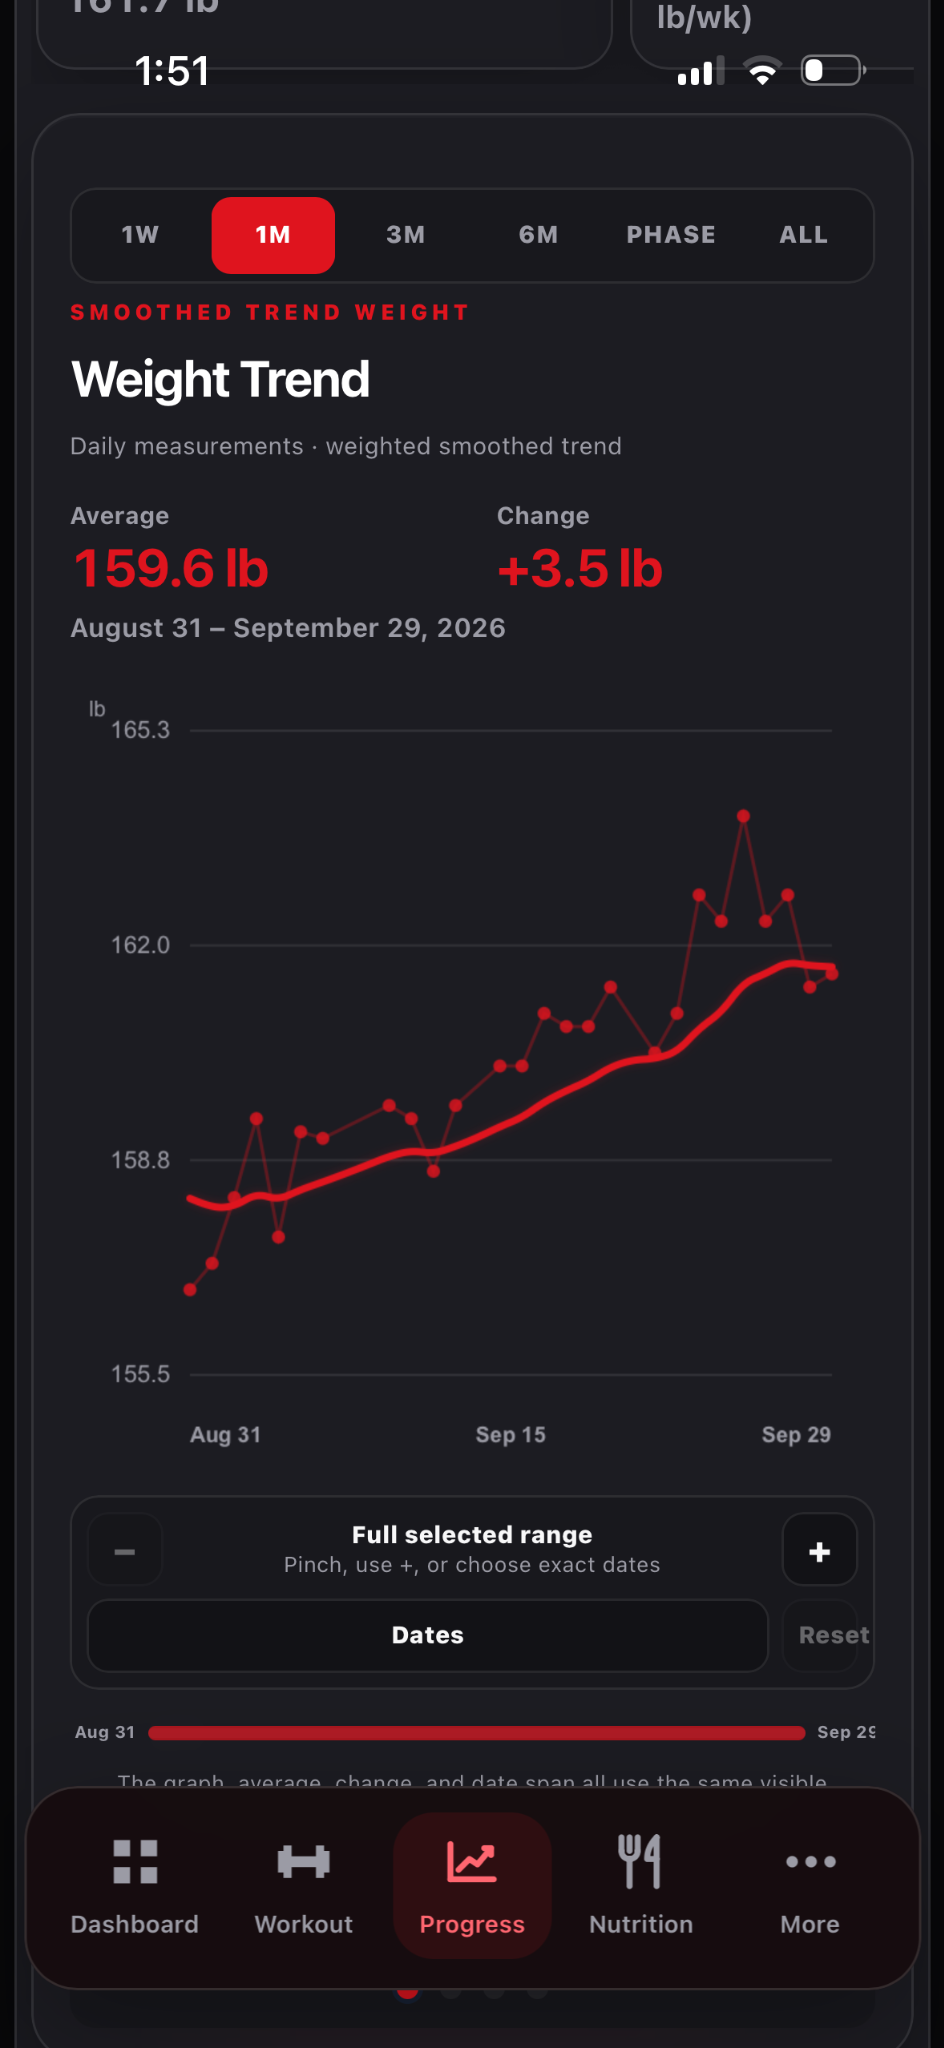
The chart separates daily measurements from a smoothed direction.
How to use it
- Open Progress → Weight and add a weigh-in.
- Select 1W, 1M, 3M, 6M, Phase or All.
- The faint points and line show individual measurements; the main line shows the smoothed trend.
- Average, change and date span follow the visible chart window; pinch or use Dates to focus.
See it in Level Up
What the evidence means
A smoothed trend can keep rising briefly after a flat or lower day because prior measurements still contribute. Use consistent weigh-in conditions and a longer window to assess direction.
Research and further reading
How Trend Weight is calculated
Level Up stores one valid weigh-in per date. If you edit a date, the newer entry replaces that day’s value. The pale points on the graph are actual scale measurements. For missing dates between two weigh-ins, the app fills a straight line between those measurements so the smoothed line advances by day. These filled values are calculations, not invented weigh-ins; it does not project beyond the latest recorded day.
If Monday is 160 lb and Wednesday is 162 lb, the interpolated Tuesday value is 161 lb. The chart still distinguishes actual measured points from its smoothed line.
Step 2 · Smooth the daily seriesNew trend = 0.15 × today’s value + 0.85 × yesterday’s trendThe first trend value starts at the first weigh-in. Recent values carry more weight, while older measurements fade gradually. This is an exponentially weighted moving average, with 0.15 as the app’s fixed smoothing factor.
How the weekly rate is calculated
The weekly trend rate uses the most recent 21 calendar days of the smoothed series. Level Up fits a straight line through those daily trend values and multiplies its slope in pounds per day by seven. In simple terms, it asks which weekly direction best describes the whole window. It is not the difference between just the first and last scale readings.
The app needs at least three actual weigh-ins spanning five days before reporting a rate. With fewer than six actual entries spanning 14 days, it labels the rate preliminary. More data makes the direction less sensitive to one unusual weigh-in, though it remains an estimate.
If the recent smoothed line was climbing, a 161.6 lb weigh-in can slow that climb without immediately reversing the fitted slope across 21 days. Several lower or stable measurements generally need to pull the trend line downward before its 21-day slope turns negative. There is no single target weigh-in that guarantees a change because the full history matters.
Other weight numbers in the app
A seven-day average is simply the mean of actual measurements within that seven-day calendar window. Some nutrition and maintenance calculations intentionally use a separate regression on raw weigh-ins. Those numbers can differ from the visible smoothed trend rate because they answer different questions. The Average and Change above the interactive graph refer to the selected visible date span.
Daily weight reflects food and fluid in the body as well as tissue change. Use similar weigh-in conditions, several weeks of data, and the goal context before changing a calorie target.
Sources
- NIDDK Body Weight Planner — dynamic weight change context. The app’s 0.15 smoothing factor and 21-day regression are Level Up design choices, not values prescribed by this source.